How to
remote debug Java program in Eclipse
Remote
debugging is not a new concept and many of you are aware of this just for who
don’t know what is remote debugging? It’s a way of debugging any process could
be Java or C++ running on some other location from your development
machine. Since debugging Java application is essential part of Java development and ability to
debug your application not only saves time but also increase productivity. Local
debugging is the best way to debug Java program in my opinion and should always be preferred over
remote debugging as discussed in my post How to debug Java program in Eclipse, but if local debugging is not possible and there is no way to
debug your process then remote debugging Java application is the solution. All Major IDE like NetBeans, Eclipse, IntelliJ allows you to remote debug Java program but I mostly use Eclipse for remote debugging Java application because it's free and standard IDE in Investment banks for Java projects. By the this is second article on Eclipse IDE in Javarevisited after sharing Top 30 Eclipse keyboard shortcuts to improve productivity in previous post.
When use Java remote debugging in Eclipse
Many of us work on a Java project which runs on Linux operating system and we
do development mostly on Windows using Eclipse IDE. Since I am working in Investment banking and
finance domain I have seen use of Linux server for running electronic trading
application quite a lot, which makes Java development difficult because you don't
have code running on your development machine. Some time we managed to run the Java project in Eclipse IDE in windows itself which is
essential for development and debugging purpose but many times its not possible
due to various reason e.g. your project depends upon some of the platform dependent library or some Linux module whose windows version may not be
available or your project is too big to run on windows and its heavily
connected to upstream and downstream system and it's almost impossible to create
same environment in your windows machine for development. On such situation my approach to work is isolate the work I am doing and
test that with the help of mock objects, Threads or by trying to run that
module independently but this is also not a desired solution in some cases
where you need to debug the Java project at run time to find out some subtle
issues, This is the time to use Eclipse for remote debugging Java application.
Eclipse IDE provides us
most useful feature called "Remote debugging" by using which
you can debug Java application running on remote Linux or Windows Server from your windows machine. believe me
this become absolutely necessary in some condition and knowing how to setup
remote debugging and working of remote debugging in eclipse can greatly improve
your productivity. In this Eclipse tutorial I will try to explain eclipse
remote debugging or how to setup remote debugging in eclipse.
Now let's see how we can setup remote debugging in Eclipse:
1) First setup your Java project in Eclipse.
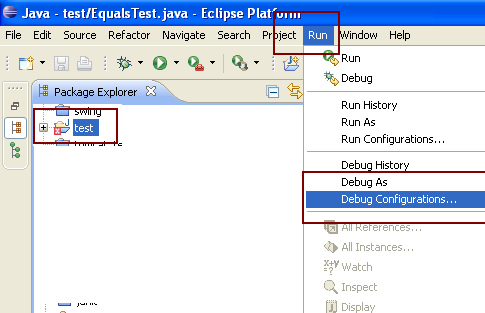
2) Select your project, go to "Run" Menu option and select "Debug
Configurations"
 |
| Remote debugging with eclipse 1 |
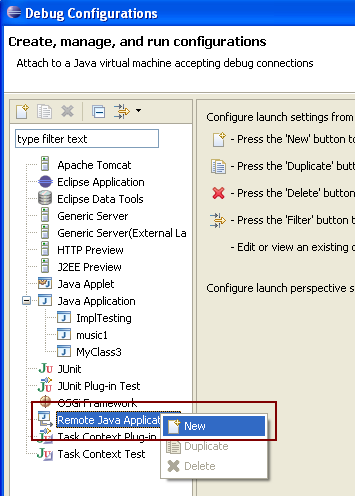
3) This will open Debug Configuration window select "Remote
Java Application" icon on left side, Right click and say
"New".
 |
| eclipse remote debugging 2 |
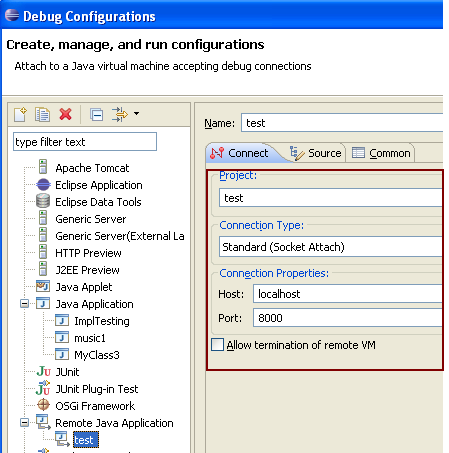
4) After clicking on New, Eclipse will create Remote Java Application
configuration for your selected project. Now next step is to setup host and port for remote debugging in Eclipse.
 |
| Remote debugging in Eclipse 3 |
5) Now put the host name and port on which your process is listening for
debugger in Linux machine. Check the "Allow termination of remote
VM" check box if you would like to close java application running
on Linux from eclipse.
6) Now you are all set to remote debug your Java project from Eclipse IDE but before
starting to debug make sure your Java process is started with Java remote debug settings and listening on same host and port, otherwise eclipse will not able
to connect successfully.
7) To debug just click the "Debug" button in last screen
where we have setup host and port.
8) You can also debug by going to "Debug Configurations"
selecting your project in "Remote Java Application” and clicking on
"DEBUG".
Java remote
debug setting and JVM debug options
In order to remote debug a Java application from Eclipse, that application must be
started with following JVM debug options:
java -Xdebug -Xrunjdwp:transport=dt_socket,address=8001,server=y suspend=y -jar stockTradingGUI.jar
This will start java application stockTradingGUI into debug mode using Java
Debug Wire Protocol (jdwp) protocol and it will listen on port 8001 suspend=y will ensure that that application will not start running until
Eclipse connect it on speicified debug port.It also important to note that application must be start before Eclipse tries to connect it other
wise Eclipse will throw error "Failed to connect to remote VM.
Connection refused" or "Connection refused: connect"
Enjoy remote debugging in
Eclipse J
How to fix "Failed
to connect to remote VM. Connection refused"
"Failed to connect to remote VM. Connection refused" is the most common error Java programmer face
while trying to remote debug Java application, there can be multiple reason why
you are getting "Failed to connect to remote VM. Connection refused"
error, here are some of the reason this
error occurs in Eclipse :
1) Network or Firewall issue
Since Eclipse uses TCP socket connection to connect to remote machine,
remote host must be accessible from your network and corresponding remote debug
port must be open and ready to accept connection. You can check this by using networking commands in windows and Linux like ping or telnet.
2) Java application not running on remote host
This is probably most common reason of "Failed to connect to
remote VM. Connection refused". If Java application is not running
there will no one to accept connection. Just restart the Java application in
debug mode.
3) Incorrect host and port combination
One of the human error which causes "Failed to connect to remote VM.
Connection refused". Some time typo on hostname or port causes Eclipse
trying to connect different servers or different port, which is obvious reason
you get this error.
4) Missing JVM debug settings
In order to accept remote connection from Eclipse your Java application
must be running with correct debug settings based upon your JVM. If you are JVM
is not running on debug mode you will get "Failed to connect to remote VM.
Connection refused"
Java
Remote debugging Tips in Eclipse IDE
Here are few tips which is very useful while
remote debugging any Java program into Eclipse IDE, this not only help you to
avoid some common errors in Eclipse but also makes remote debugging much easier
:
Tip: In JVM
DEBUG parameters there is a parameter called "suspend" which
takes value as "y" or "n". so if you want to debug the
process from start set this parameter as "suspend=y" and
your Java application will wait until Eclipse remotely connect to it. Otherwise
if you want to run your program and later want eclipse to be connected that set
this as "suspend=n" so your java application will run normally
and after eclipse remotely connected to it, it will stop on breakpoints.
Tip: Use
start up script to put JVM debug parameter and use a variable e.g.
isDebugEnabled and also REMOTE_DEBUG_PORT in the shell script and export this
variable when you want to remote debug your Java application. This will be very
handy and will require just one time setup work.
Tip: if you
get error "Failed to connect to remote VM. Connection refused"
or "Connection refused: connect" then there might be
two possibility one your java program is not running on remote host and other
you are giving incorrect port or host name after verifying these two things if
issue still persists then try giving full name of the host.
Tip: You
also need to ensure that you run the same code base in eclipse which is deployed
in your remote machine so that what you debug and see in eclipse is true
and real. you also need to ensure that your code is compile with debug
option "-g" so that eclipse can easily gather debug info
e.g. information about local variable. by default java only generate line
numbers and source file information.with debug option -g your class
file size might be more because it would contain some debug information.
Note: Recently I have wrote another article 10
tips on debugging Java Program in eclipse which is a collection of my
java debugging tips and explains some advanced java debugging concept like
conditional break point, how to debug multi-threaded programs in Java, Step
filtering to avoid debugging system classes in Java, logical view to see the
content of collection classes like HashMap or ArrayList in Java.
If you like to learn some really useful Eclipse keyboard shortcuts you
can check here Top
20 useful Eclipse keyboard shortcuts.
Tidak ada komentar:
Posting Komentar